DGCT Retail Solutions

Your store is a media channel, a data source and a point of sale. We connect all three.

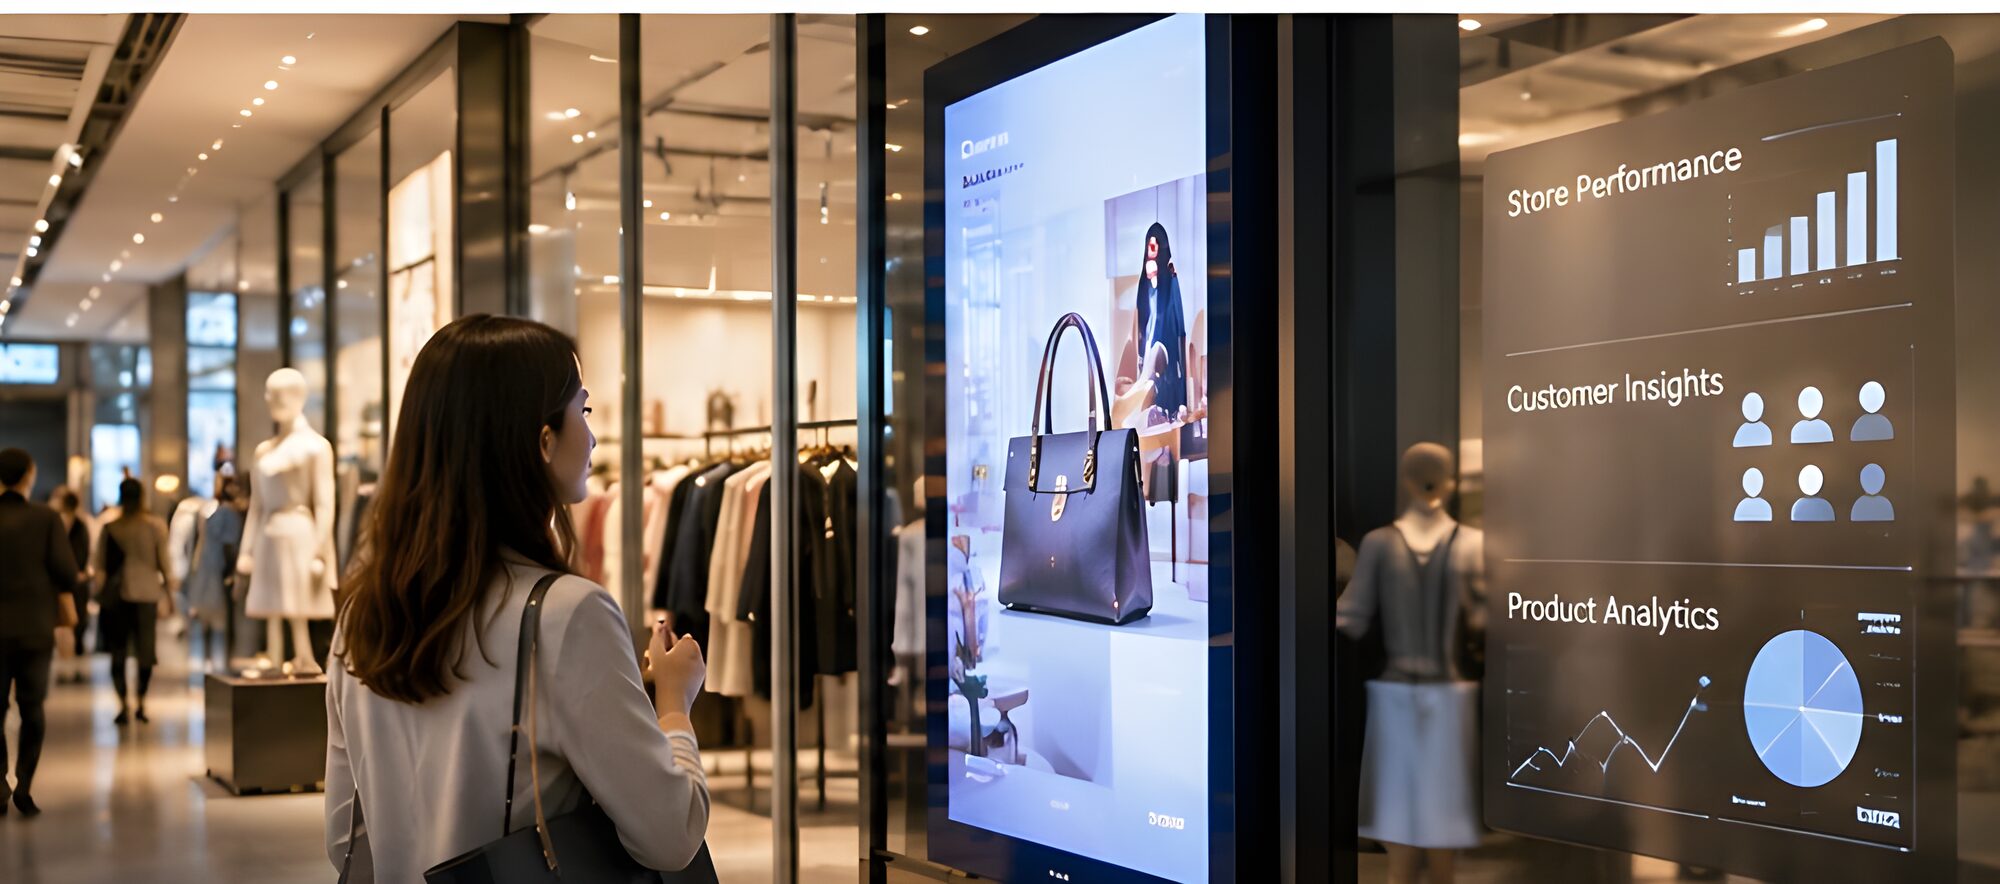
Shopper in a store with digital screens and analytics

Most retailers run their in-store screens, people counters, stock systems and tills as separate worlds. DGCT brings them into one platform: plan and run in-store communication and advertising, measure who is in the store and in front of each screen, and link every campaign to the stock on the shelf and the sales at the till.

In-store Retail Media Media Planning Footfall & Audience Stock-aware Content Proof of Sale Store Intelligence
The in-store loop
CommunicateRetailer messages, supplier brands and external advertisers on one screen network.
ObserveFootfall, zone traffic, dwell time and anonymous audience in front of each screen.
StockSKU availability, days of cover and shelf life of fresh products, store by store.
SellItem-level receipts, baskets and promotions, down to 15-minute slots.
Every sale measures the last campaign and shapes the next one.
What we see in stores

Retail runs on thin margins and disconnected systems.

Behind every store dashboard sit a few hard truths. They are the reason we designed the platform the way we did.

The till only sees the buyers

POS data describes the shoppers who bought. The ones who walked in and left empty-handed are invisible, so conversion, the most basic store KPI, is missing half of its equation.
Screens that ignore the store

The same playlist runs at 8:00 and at 19:00, in a business-district store and a residential one, whoever is in the aisle and whatever is on the shelf.

Promoting what isn't on the shelf

A campaign for a product that is out of stock wastes the screen, disappoints the shopper and gives the brand that paid for it nothing in return.

Brands want proof, not playlists

Suppliers move trade-marketing budget to in-store media when the retailer can show the audience reached and the extra sales generated, not just a list of plays.

No two stores are alike

Commuter, lunchtime, family and evening top-up stores have different peaks, baskets and audiences. Chain-wide averages hide the differences that matter.

Fresh has a clock

Every fresh product still on the shelf at closing time is margin lost as waste. The window to act is counted in hours, not weeks.

One platform, three signals

Communicate. Observe. Sell.

DGCT combines two decades of in-store media and audience measurement experience (adooh) with the iCrunch data and AI platform, so the three data streams of a store live in one model instead of three systems.

A · Communicate

In-store media & campaign management

Run every screen in the store (entrance, aisle, end-cap, checkout) as one network, with its own inventory, planning and reporting.

  • Retailer communication: promotions, loyalty, private label, services
  • Endemic advertising: supplier brands sold in the store
  • Non-endemic advertising: banks, telecom, mobility, services
  • Media planning by store cluster, zone, daypart and audience
  • Share of voice between house content and paid campaigns
  • Proof of delivery for every screen, content and store
B · Observe

Footfall & shopper audience

Measure how many people enter, where they go and who is in front of each screen, anonymously and continuously.

  • Footfall by entrance, 15-minute slot and day
  • Zone traffic, dwell time and heatmaps
  • Audience per screen and per content
  • Estimated age range and gender, aggregated
  • Attention and viewing time
  • Conversion rate: transactions ÷ footfall
C · Sell

SKU, stock & transactions

Connect the product catalogue, stock position and every receipt line to what happens on the screens.

  • Item → category → product-group hierarchy
  • Stock on hand, days of cover and stock-out risk per SKU and store
  • Receipt lines: quantities, prices, promotions, coupons, returns
  • Basket value, units per basket and product mix
  • Loyalty members and repeat visits
  • Wastage and near-expiry fresh products

Privacy by design. Audience measurement produces anonymous, aggregated counts and estimates: no individual is identified. Loyalty and customer data remain under the retailer's governance and are only used in aggregated form for media reporting.

When the signals meet

The value is in the connections.

Each signal is useful on its own. Combined, they answer the questions that retailers and their brand partners actually ask.

ShoppersTill

Store conversion

Transactions divided by footfall, per store and per 15 minutes. It tells whether a bad day was a traffic problem or a selling problem, and when to open another checkout.

ScreensShoppers

Audience-based media planning

Plan and sell in-store campaigns by audience delivered (who, where, when) instead of by number of loops. Forecast available inventory per store cluster and daypart.

ScreensShelf

Stock-aware content

Campaigns follow the shelf: a product message pauses when stock-out risk rises, while overstocked lines and near-expiry fresh products get the airtime.

ScreensShoppersTill

Proof of sale

Compare sales of the promoted SKUs in exposed stores and time slots against comparable control stores. Report incremental sales to the brand, not only impressions.

ScreensTill

Mission-based dayparting

15-minute basket profiles reveal shopping missions such as breakfast, lunch, evening top-up and the weekly shop. Content is scheduled to the mission in progress.

ShoppersShelfTill

Store clusters

Group stores by traffic pattern, basket, audience and assortment. Plan media, stock and promotions per cluster rather than against a chain average.

An illustrative weekday

The store changes every hour. So should the screens.

The same supermarket serves different shoppers and missions across the day. This is how the three signals decide what plays, and when.

07:30

Commuter rush

Signal
Short visits, one- or two-item baskets, entrance traffic peaking.
Action
Coffee and breakfast offers at the entrance and checkout.
12:15

Lunch peak

Signal
Checkout queue building, meal-deal SKUs selling fast.
Action
Meal-deal content, switched to an alternative when sandwich stock runs low.
15:00

Quiet afternoon

Signal
Lower traffic, longer dwell, different shopper mix.
Action
Longer brand formats, loyalty and in-store services.
18:30

Evening top-up

Signal
Highest footfall of the day, larger baskets, working-age audience.
Action
Premium advertiser slots: the audience most brands want to reach.
20:30

Before closing

Signal
Fresh products with stock left and a short shelf life.
Action
Markdown messages on those products to cut waste.
Closed-loop measurement

From proof of delivery to proof of sale.

Brands fund in-store media when they can see what it did. DGCT links each step of the chain on the same data, so every campaign report ends at the till.

Played Which content ran, on which screen, in which store, at what time.
Seen How many shoppers were in front of it, which profiles, for how long.
Bought Sales of the promoted SKUs, receipt line by receipt line.
Proven Uplift against control stores and periods: incremental sales and return on media spend.
Built on real retail data

Modelled on a live supermarket dataset.

Our retail data model was built and tested on the POS data of a multi-store supermarket chain: receipt headers and receipt lines, product hierarchy, promotions, returns, loyalty and store geography, aggregated down to 15-minute store slots.

  • One receipt, many lines: basket-level and item-level views
  • 15-minute store aggregates for traffic and revenue patterns
  • Store geography and clusters for location benchmarking
  • Dashboards from executive overview to 15-minute store operations
Retail data has traps. We know them.
A receipt line is not an item. One line can carry six units, and a return is a negative quantity.
Receipt numbers repeat. A receipt is identified by store, till and number together, never by its number alone.
Discounts live at several levels. Line, periodic promotion, coupon and receipt discounts must reconcile with what was actually paid.
Totals double-count easily. Summing receipt totals after joining them to their lines counts revenue once per line.
Codes drift between systems. Normalised store and product codes keep history comparable when source codes change.
Ask your stores

From dashboards to direct, governed answers.

With iCrunch Pulse, store, category and media teams ask questions in plain language across screen, audience, stock and sales data, while schema, filters, values and execution rules remain governed and reproducible.

Which stores had high footfall but low conversion between 17:00 and 19:00 last week?
Which campaigns played in stores where the advertised product was out of stock?
What was the sales uplift of Brand X's promoted SKUs in exposed stores versus control stores?
Which screens reach the most 25–44 year-old shoppers during weekday lunch?
Which fresh products are likely to be wasted tonight, and which stores still have screen time to promote them?
Who benefits

Value for everyone in the aisle.

For the retailer

  • A new, high-margin media revenue line
  • Higher conversion and basket value
  • Less fresh-product waste
  • No airtime wasted on out-of-stock products
  • One view of every store

For brands & advertisers

  • Reach shoppers at the moment of purchase
  • Buy in-store media by audience
  • Proof of delivery enriched with audience
  • Incremental sales measurement
  • Reporting per store, campaign and SKU

For store operations

  • Staffing matched to footfall peaks
  • Queues anticipated, not endured
  • Content that updates itself
  • Remote monitoring of every screen
  • Store-level alerts on anomalies
Powered by adooh + iCrunch

One chain from screen and shelf to action.

adooh runs the screens, campaigns and audience sensors in every store. iCrunch Sense turns screen, audience, stock and sales data into predictive intelligence, and iCrunch Pulse delivers governed answers to every team. Together they form DGCT Connected Store.

adooh CMS & Campaign Management Screens, content, campaigns, media planning, proof of delivery and audience sensors across every store.
iCrunch Sense Demand forecasting, store clustering, uplift measurement, anomaly detection and recommendations.
iCrunch Pulse Governed natural-language answers for store, category and media teams.
DGCT Connected Store Retail media, shopper measurement and store intelligence in one operational solution.

Make every store a measurable media and data asset.

Let's map your screens, sensors, stock and POS data to the use cases that matter.

Talk to us